Collecting Performance and Event Logs from an Azure Arc machine using Azure Monitor
This is part two within my Azure Arc series, where I outline how you can use Azure Arc to provide Azure management capabilities to your non-Azure server estate. If you’re new here and would like to go back to previous articles in this series, have a look at the following:
In this article, we’re going to delve into performance and event logs, and how we can collect these logs from an Azure Arc machine. More importantly, we’re going to be using the Azure Monitor Agent (AMA).
Azure Monitor Agent?
For those that don’t know, the Log Analytics Agent (Also known as ‘MMA’ = Microsoft Monitoring Agent) will reach End of Support state on August 31, 2024. Microsoft have stated that the MMA agent is on a deprecation path, and are actively moving features that currently use MMA to the AMA.
Monitoring is one of those items. Previously, this would be achieved using the MMA to send the configured events to a Log Analytics Workspace, and an Automation Account can be used on top of this for Update Management. We’ll touch on update management with AMA in a future article.
Why should I care about using Azure Monitor?
Server monitoring is a core requirement for any IT department. This is commonly achieved by using 3rd party monitoring tools. These tools have a number of downsides. Key downsides that come to mind are:
Most of them are not free, usually including a per-device per month fee.
An agent is often required, usually involving privileged access.
Possible supply chain attack method via the monitoring agent (SolarWinds Orion, anyone?).
Limits on alert routing methods.
In contrast, with Azure Monitor and Log Analytics Workspace, you’re only charged for the data that you ingest and a small fee for each alert rule, meaning you might achieve cost savings. While a small agent is used, it’s a Microsoft agent, and I trust Microsoft’s security budget more than another vendor. Finally, there are numerous alert routing methods, including web hooks for integrating into most systems.
Collecting Logs on Arc Machines
So, we’ve lightly touched on the “why?” now we’ll touch on the “how?”.
If you’ve read my previous article (link above) then I’m going to continue using the same servers that I set up for that article. This involves two file servers running server core and desktop experience on Windows Server 2019. We’ll touch on how to configure alert rules in another article. For now, we’re going to configure collection of the following events
Failed Logins (Security Event Log, Event IDs 4625, 4768, 4772, 4771, 4776, 4777)
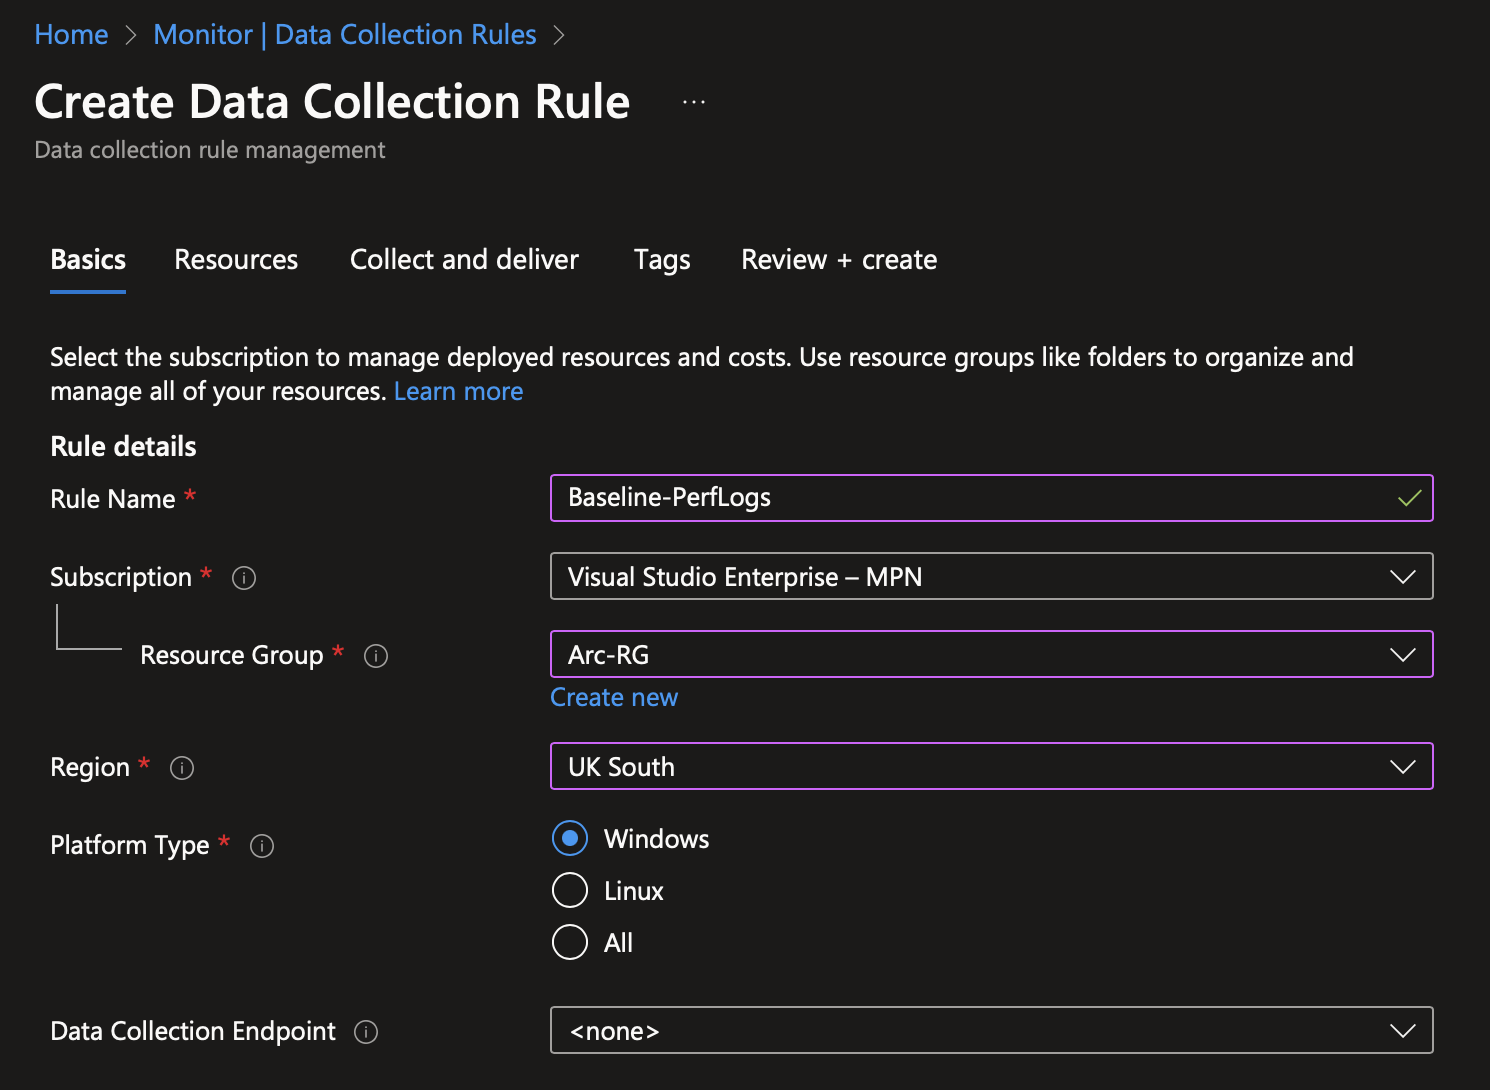
The first step is to create our workspace. Go ahead and create a workspace - there’s not much to configure other than the name and location.
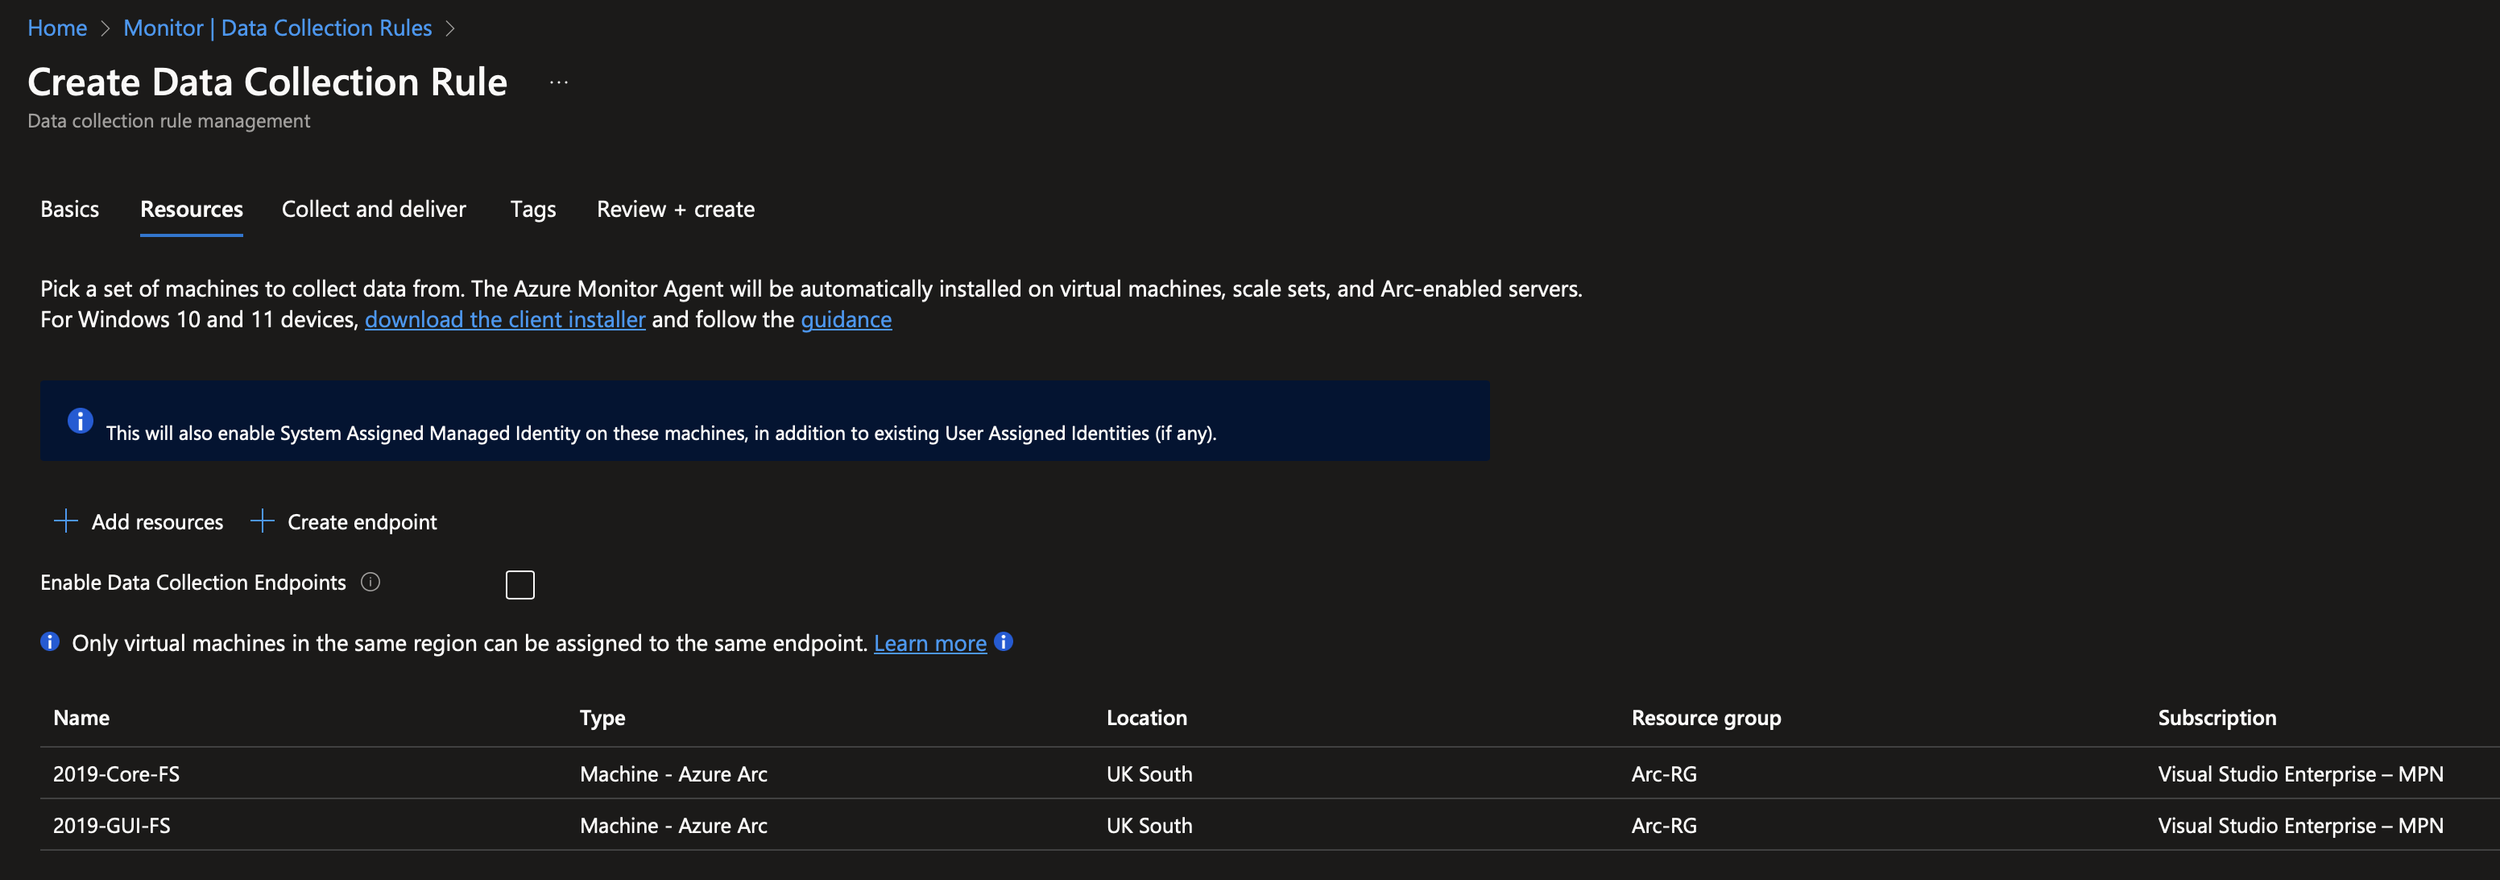
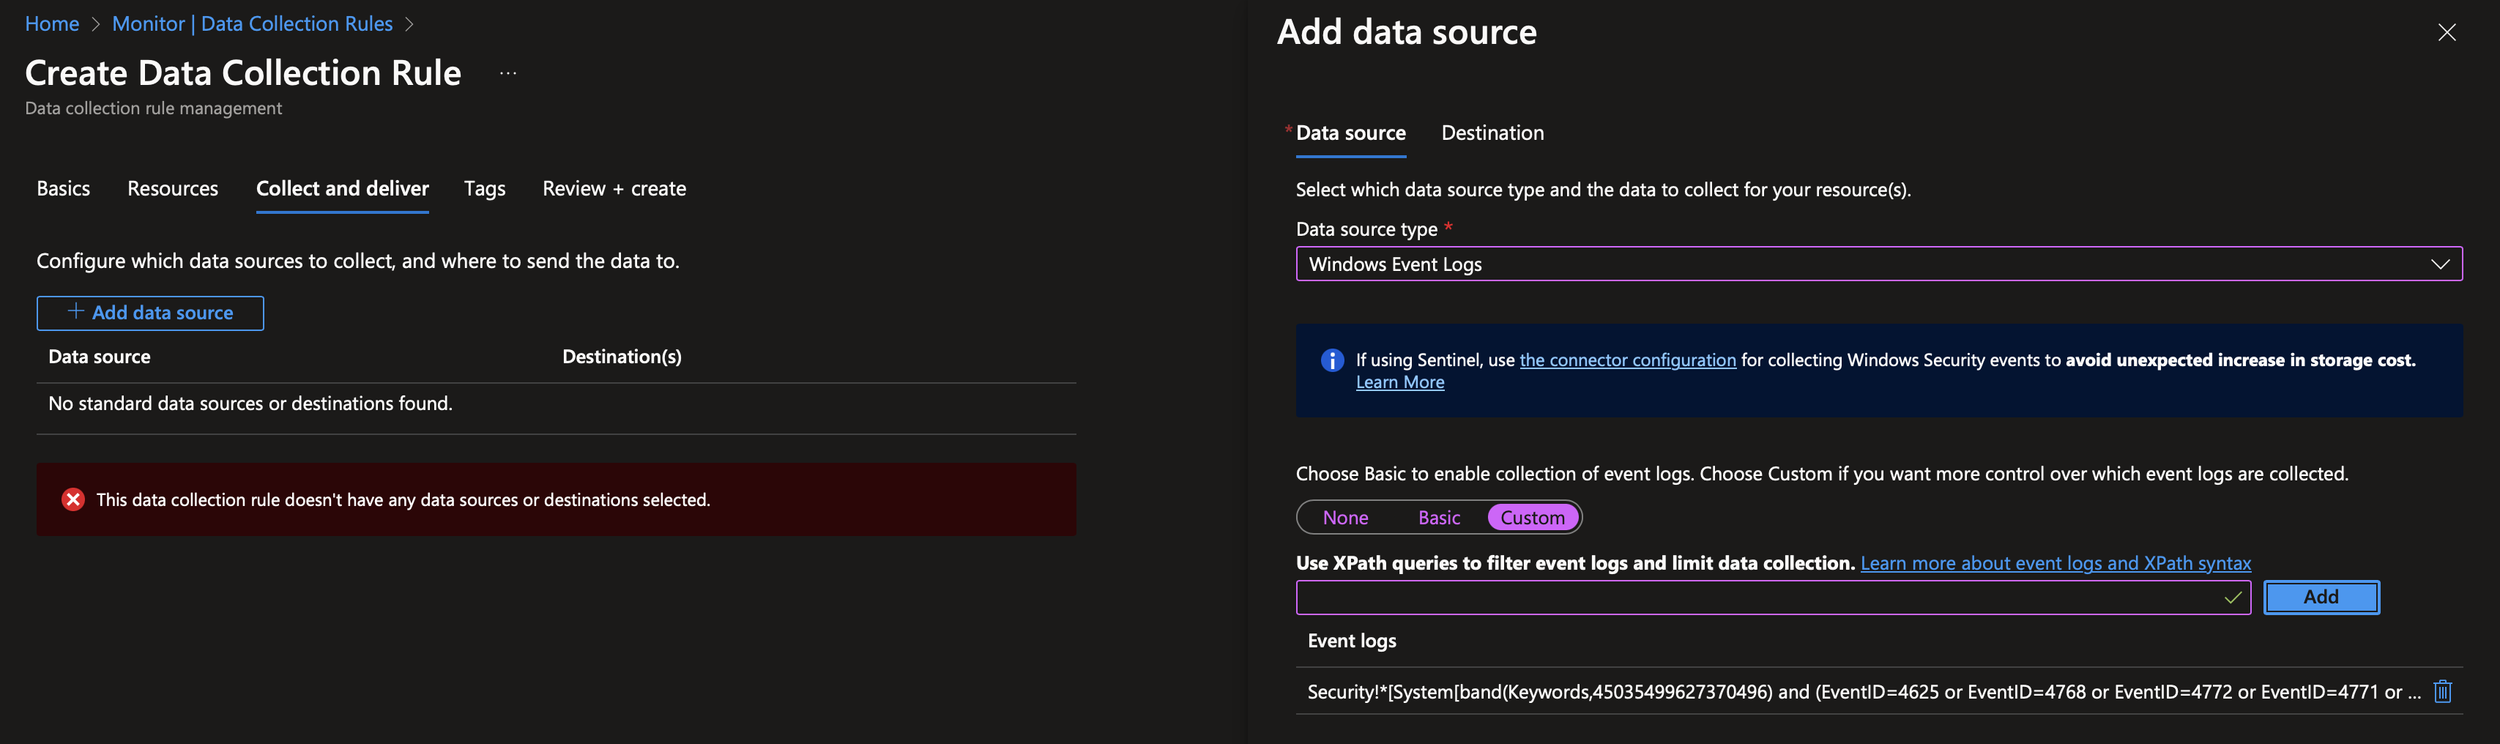
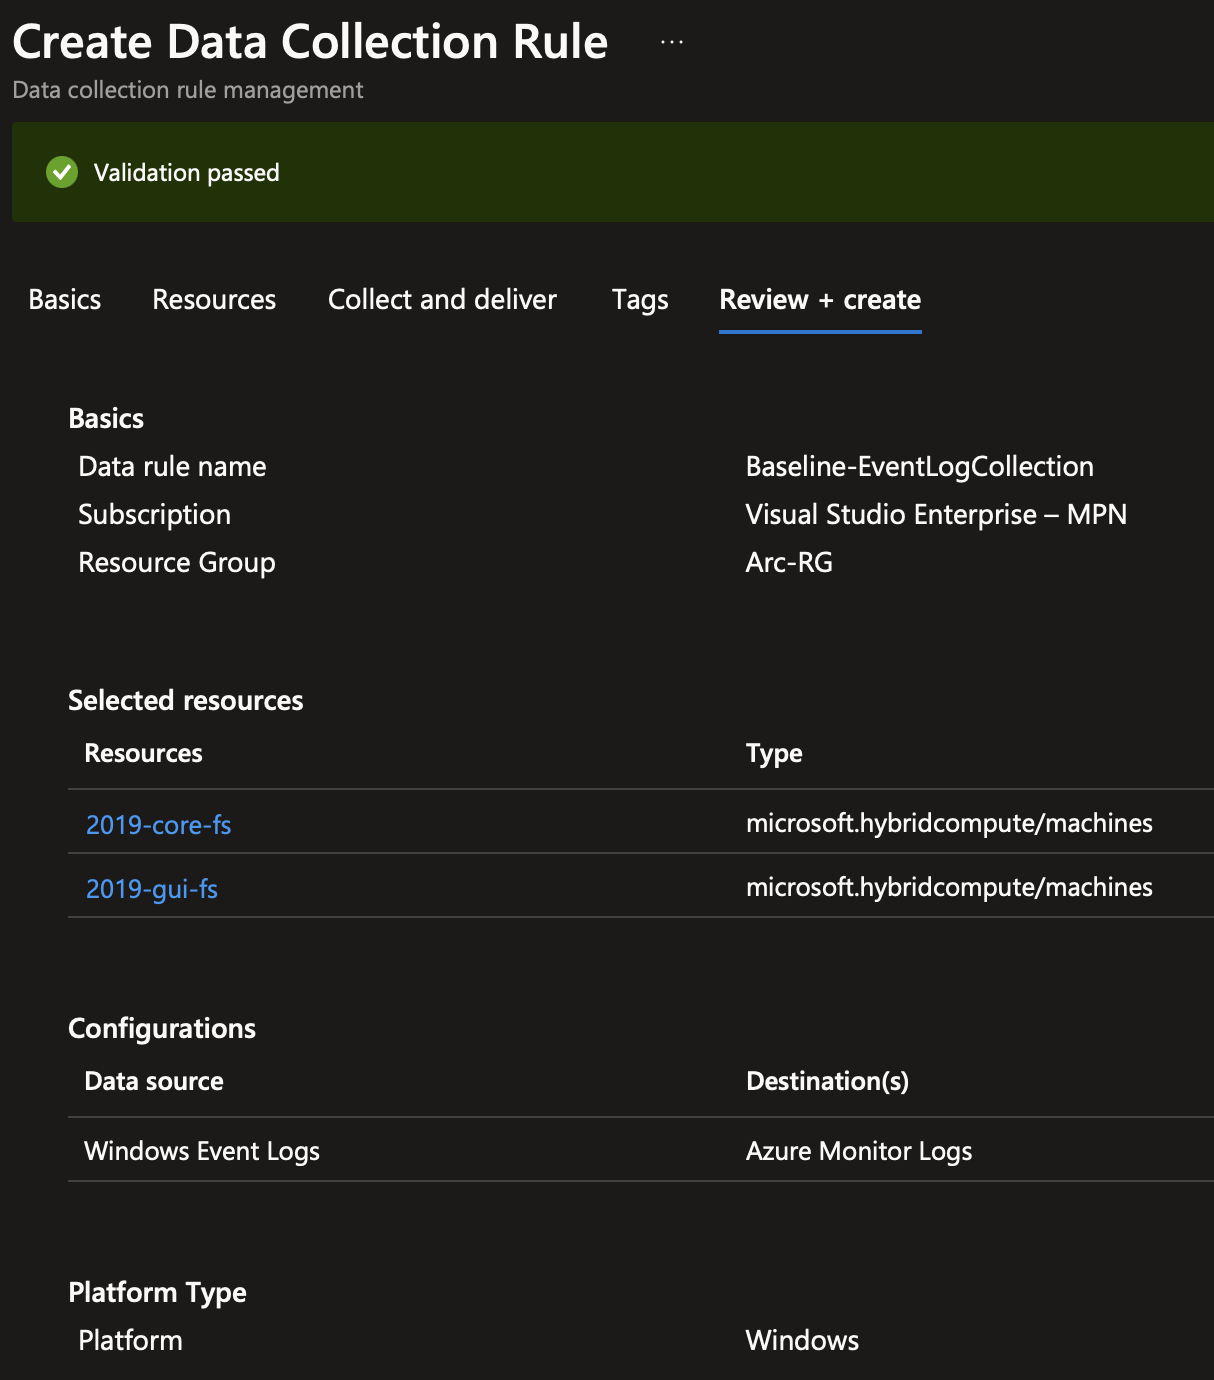
Once that’s done, head over to Azure Monitor and scroll down to Data Collection Rules (DCRs). Create a new DCR. A Data Collection Endpoint (DCE) isn’t required. Add your Arc machines and then configure the event logs to collect. Event Log collection relies on configuring the XPATH for the log. Microsoft have some decent documentation about this here however for simplicity, I’ve included the XPATH for the above events below:
Security!*[System[band(Keywords,45035499627370496) and (EventID=4625 or EventID=4768 or EventID=4772 or EventID=4771 or EventID=4776 or EventID=4777)]]
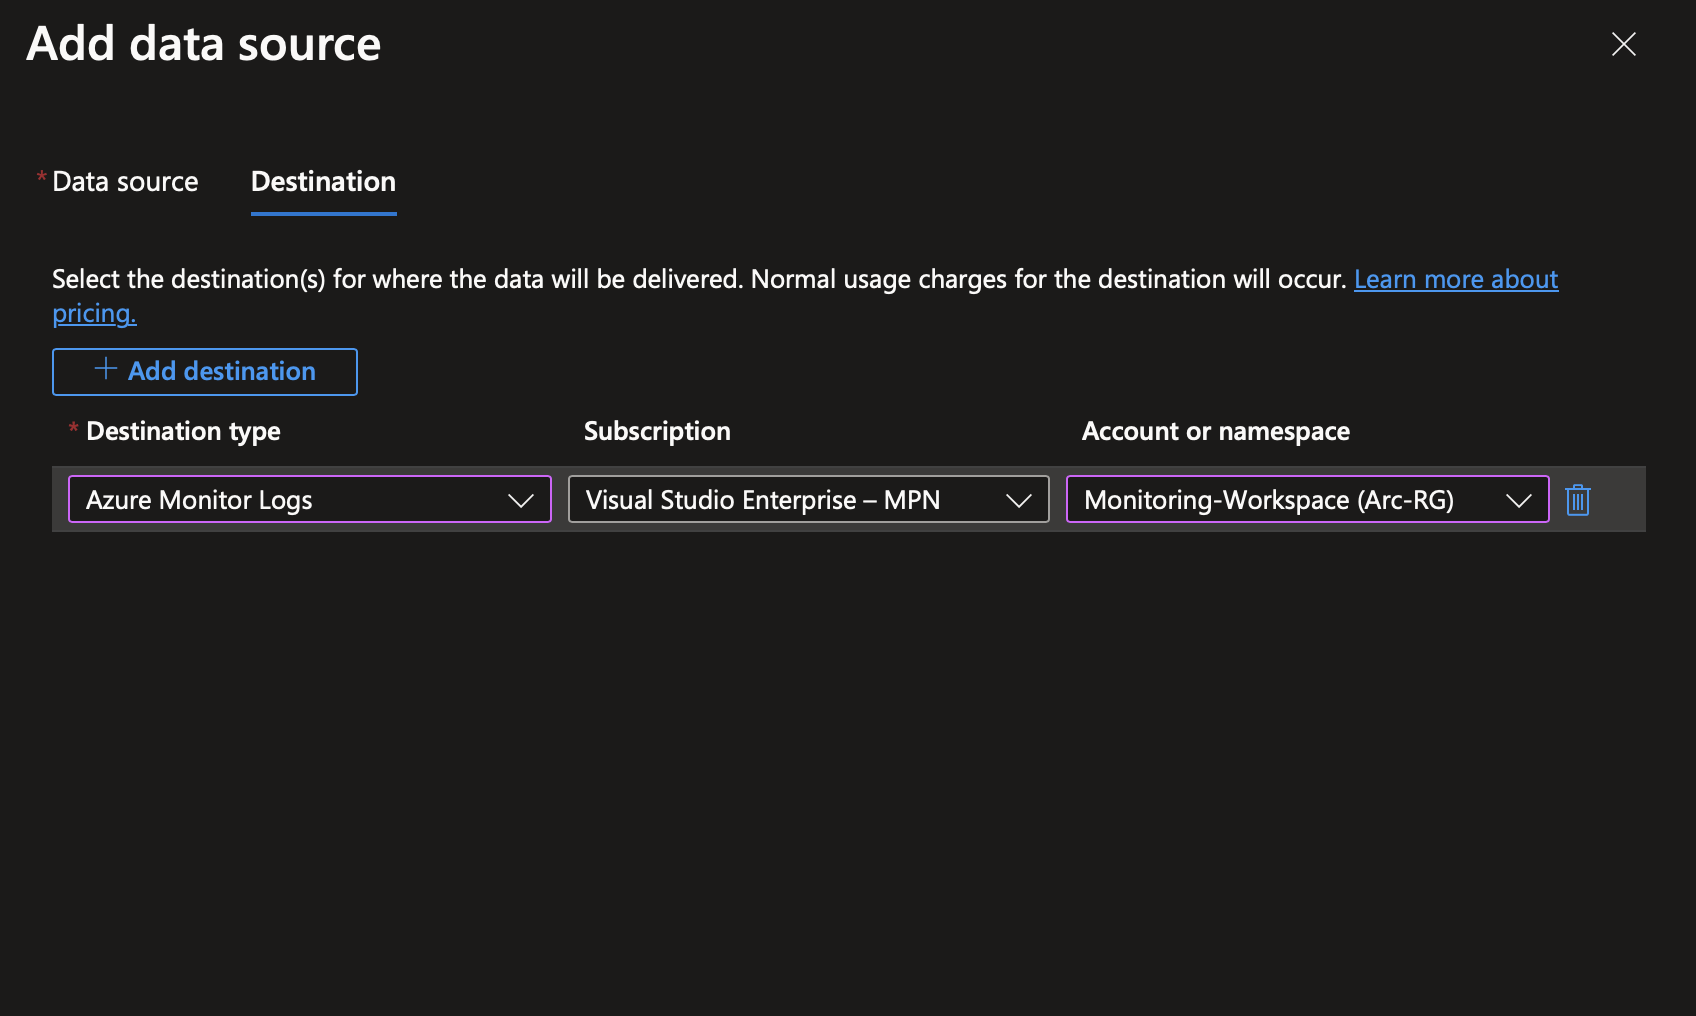
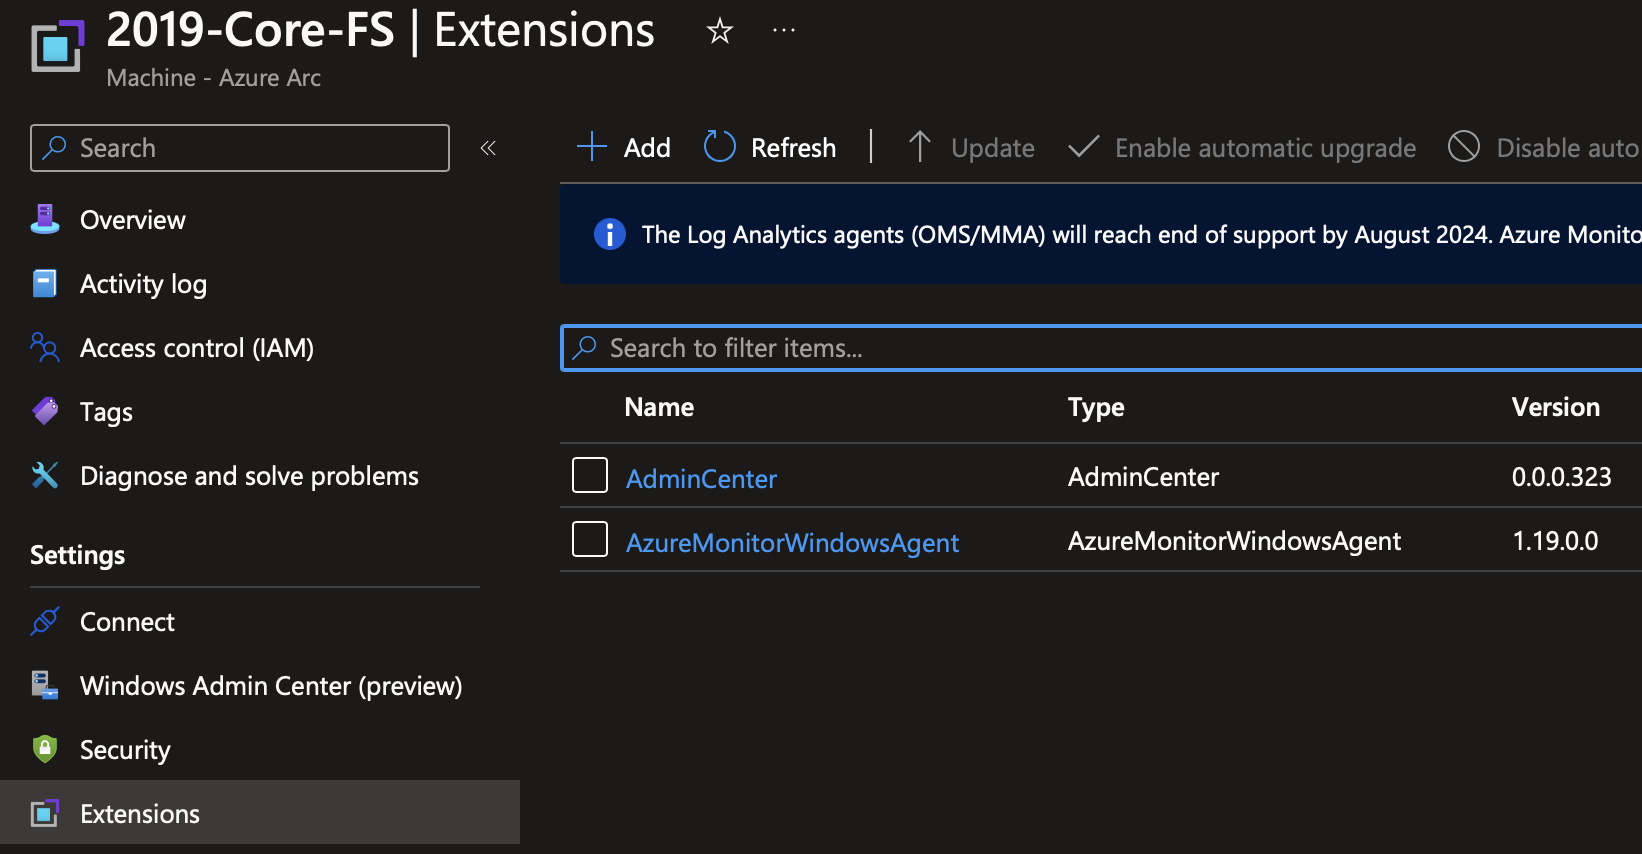
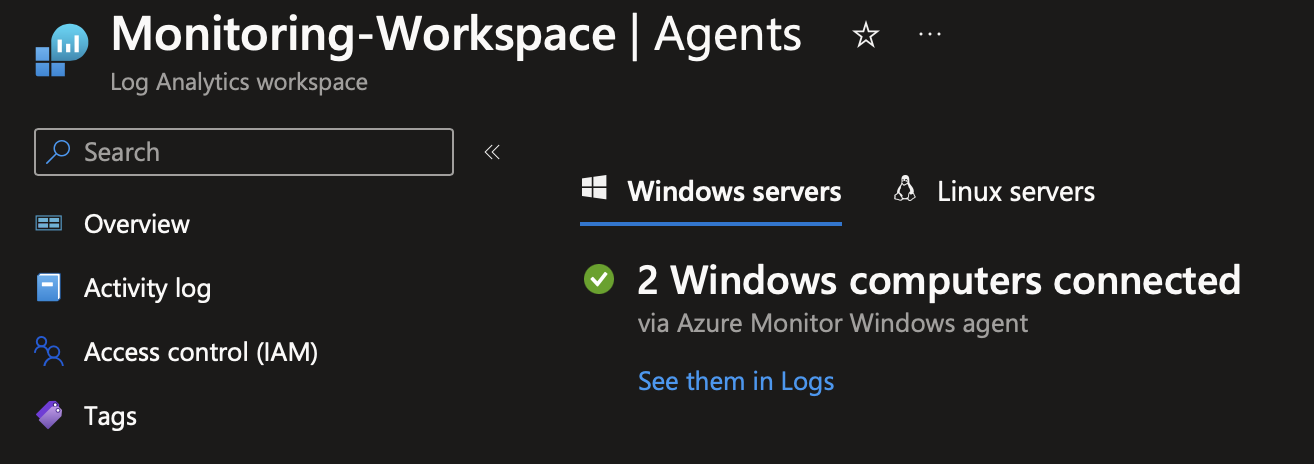
We’re going to configure this data to go into our Log Analytics Workspace. Once deployment is complete, you’ll see that the Azure Monitor Extension has been installed on the Arc machine. We can also see this on the Log Analytics workspace itself.
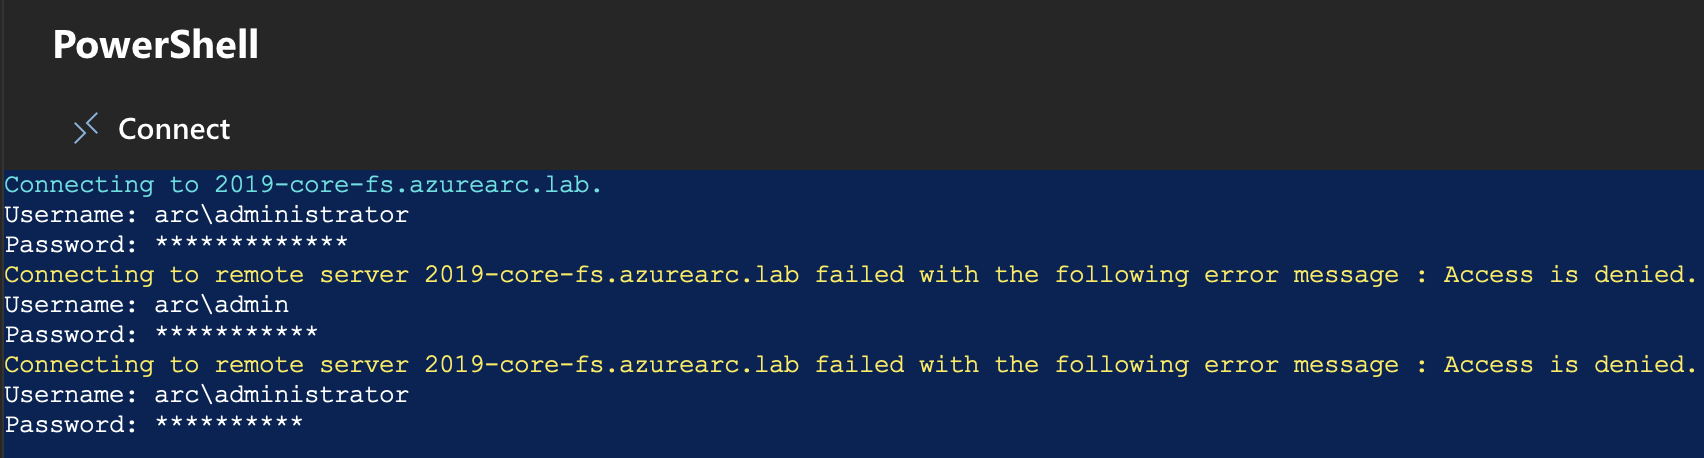
I’m now going to generate some data by deliberately entering incorrect credentials. This will create the event logs that we’re collecting.
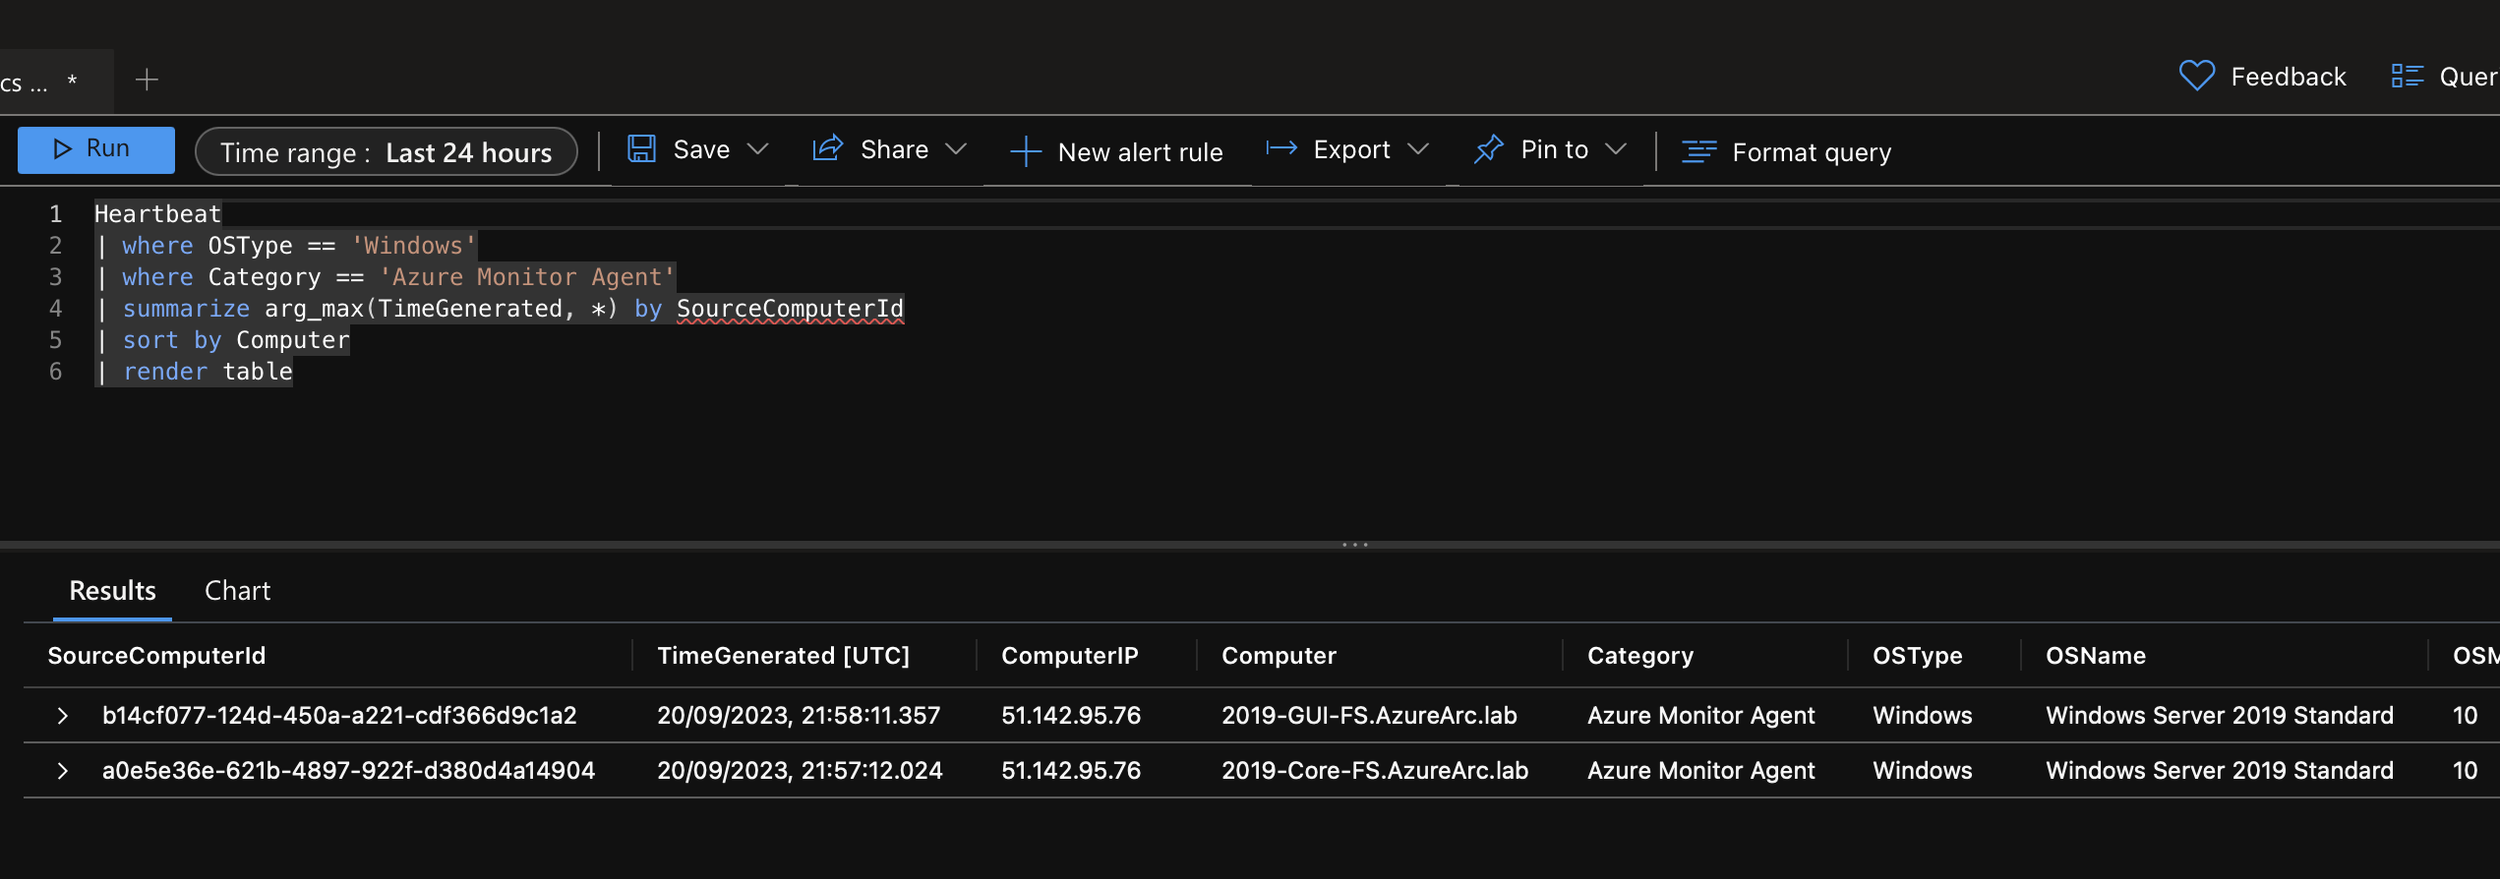
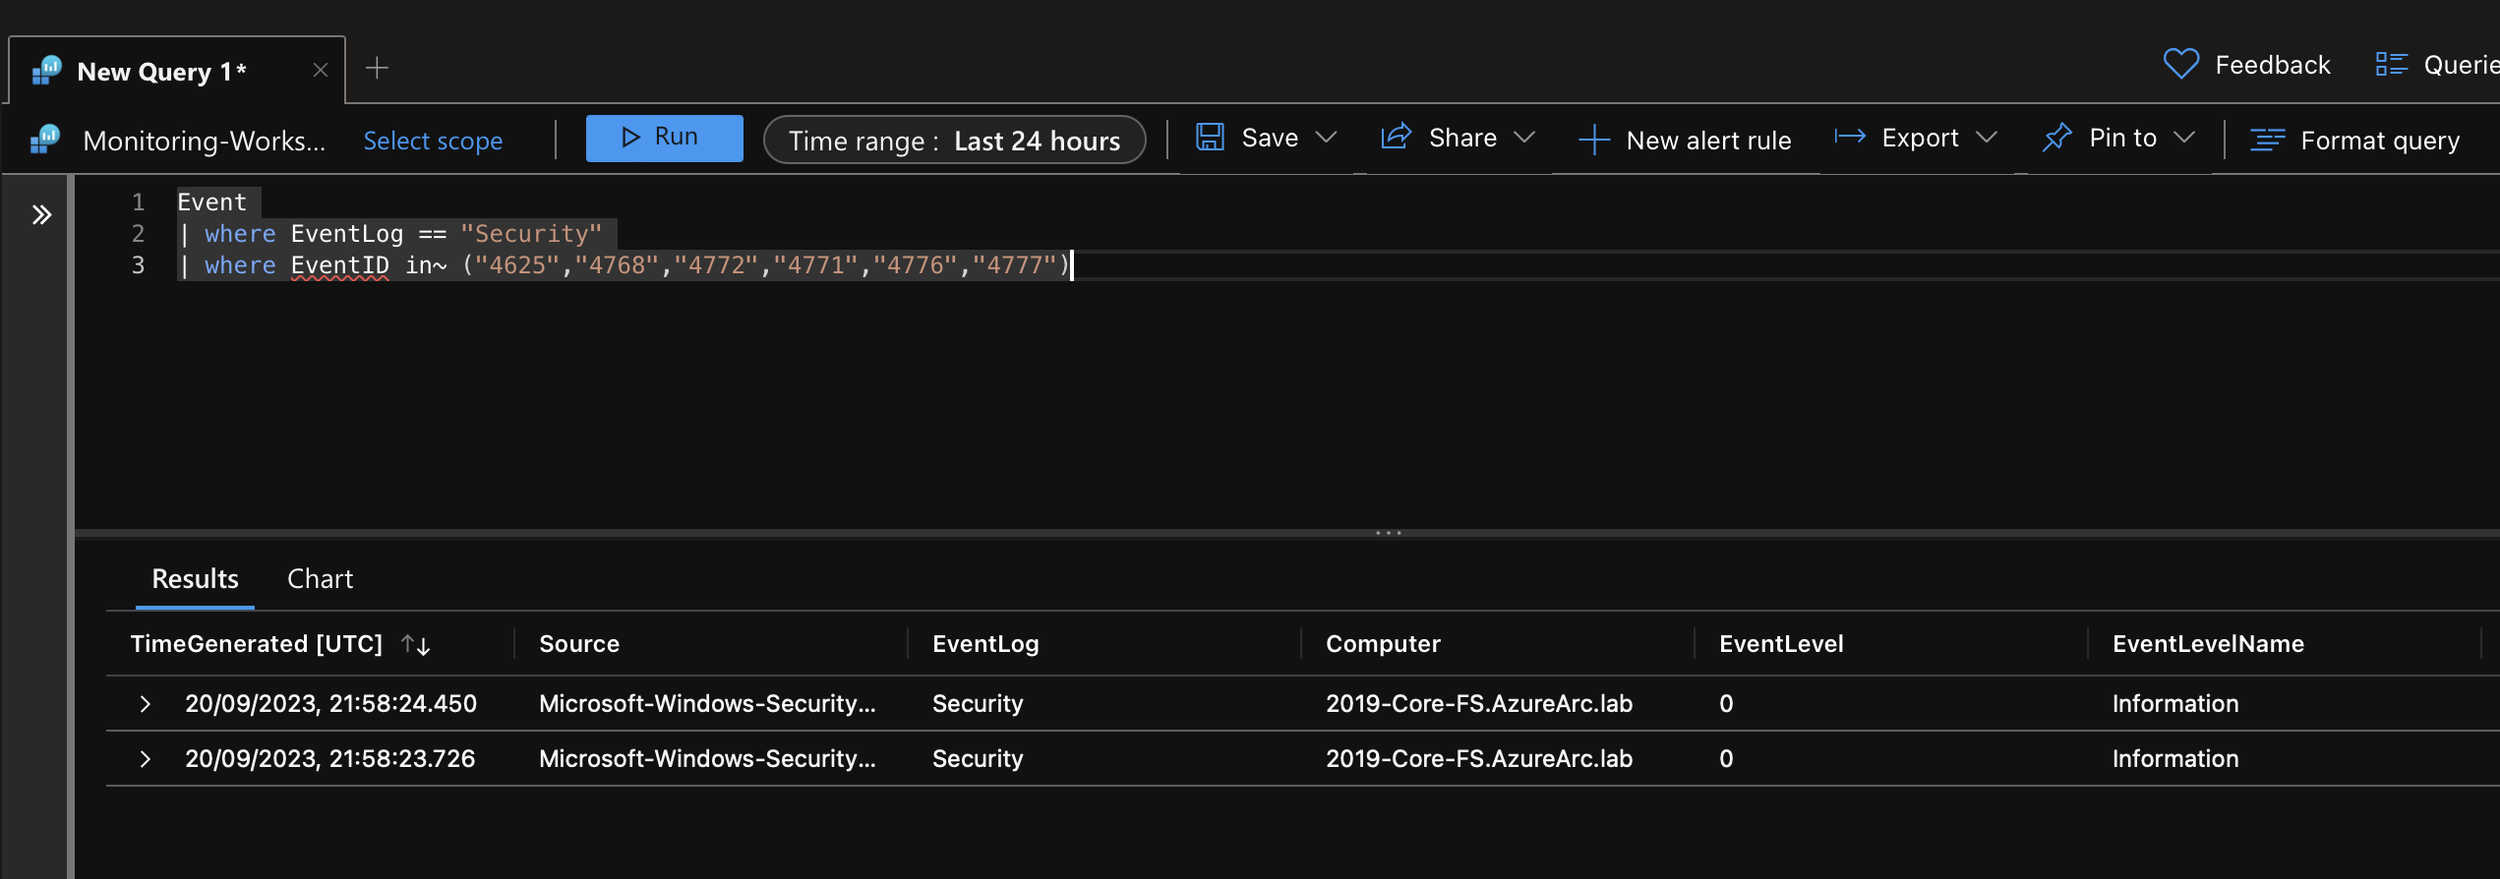
We can then use the following KQL query to view the events that were collected.
Event
| where EventLog == "Security"
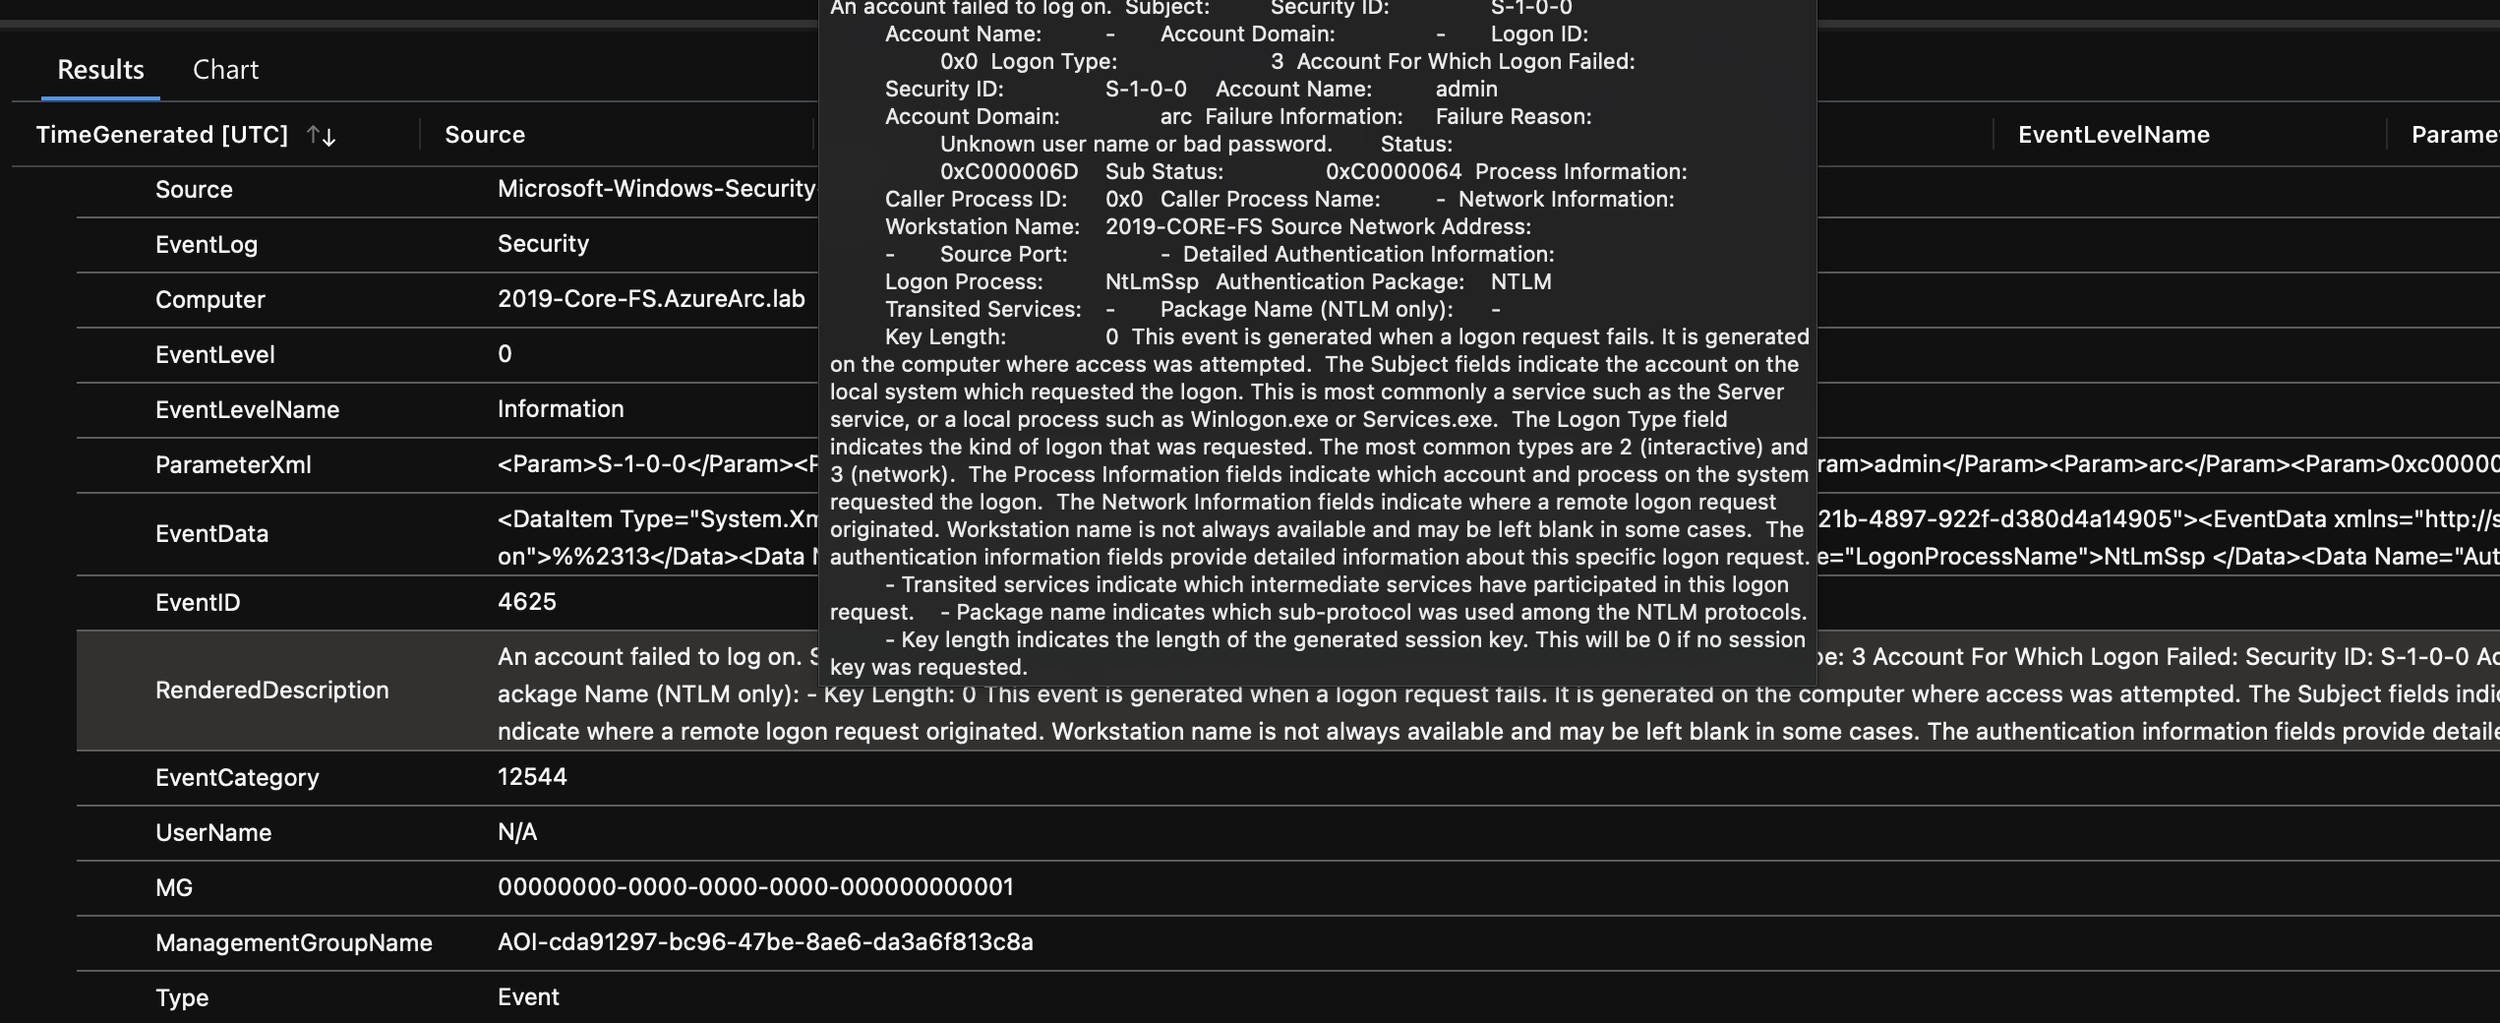
| where EventID in~ ("4625","4768","4772","4771","4776","4777") We can then see our events, and we can expand to get the full detail. Here we can see the username and password I entered incorrectly on purpose. We can see “Account Domain: Arc” & “Account Name: admin”.
Wrapping up
While this was a small example, hopefully it provides a good starting position to configure the necessary event log collection that you need. From here, you can then build alert rules on top to alert you on a specific criteria or threshold.
For example, I might want to be alerted when there are more than 50 failed logins for my machine.
Sound like an interesting topic? Well, that’s next on the series so stay tuned!
As always, any comments/feedback are appreciated.
Until next time!